First things first, 1941, the state of Jammu and Kashmir had 3 divisions (provinces): Kashmir Province having district Baramula, Anantnag (Srinagar city was part of it) and Muzaffarabad (only Kashmiri part that Pakistan took in 1947 war, although again ethnically the place is not Kashmiri ); Frontier Division had Ladakh, Baltistan and Gilgit Agency; Jammu Division had Jammu District, Kathua, Udhampur, Mirpur and Riasi, as also Jagirs of Chenani and Poonch.
Jammu Division/Province: The Basics
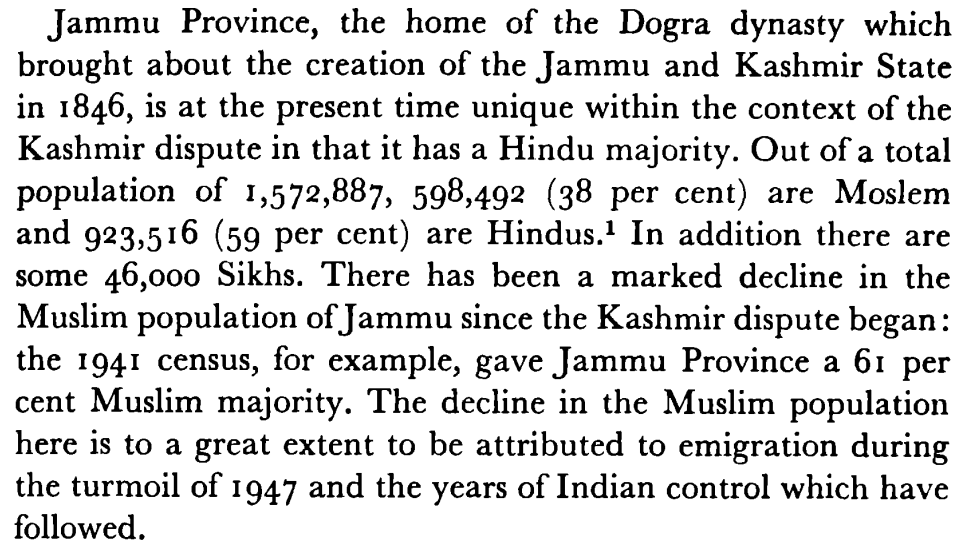
Jammu District is different from historic Jammu Division. In 1941, Jammu Division (not Jammu district which was part of Division) was Muslim Majority: Muslims about 61% and non-Muslims at about 38%. [ 7.63 lakh Hindus, Jains and Sikhs, and 12.16 lakh Muslims].
This needs to be emphasised as people for decades have been confused by it and numbers often misused for representation. And example of one such misrepresentation:
In Jammu Division, areas like Mirpur District (overall about 19% was Hindu and Sikhs) had tehsil Bhimber (about 35% was Hindu and Sikhs), Kotli and Mirpur . Mirpur District along with Western part of Poonch (which overall was 90% Muslims), Haveli, (most of)Bagh (where Sikhs outnumbered Hindus) and Sudhnoti (where bulk of Hindus of entire Poonch lived) that were once in Jammu Division are now also POK. So a major part of Jammu Division is what Pakistan went ahead and named “Azad” Kashmir, thus now Mirpuris, who are ethnically closer to Dogras, go around using the word “Kashmiri”, just because if conflict is a currency, “Kashmiri” is a cool Dollar. In these very areas, the minorities have been decimated so there is no figure to compare with performance of minorities in Indian part. And this didn’t happen over decades, but this demographic changes was swift in aftermath of 47.
In 1941 census, Jammu District had only 4 tehsils: Akhnoor, Jammu, Sri Ranbirsinghpura and Samba. Jammu city was (is) just part of Jammu District. Today’s Jammu District has 21 tehsils.
Now the numbers.
Rather than just using the 1941 census figures directly, to make sense of the numbers, I am using the 1943 State Administrative report that had used the 1941 census report.
What do we find:
Jammu District, 1941: A overview
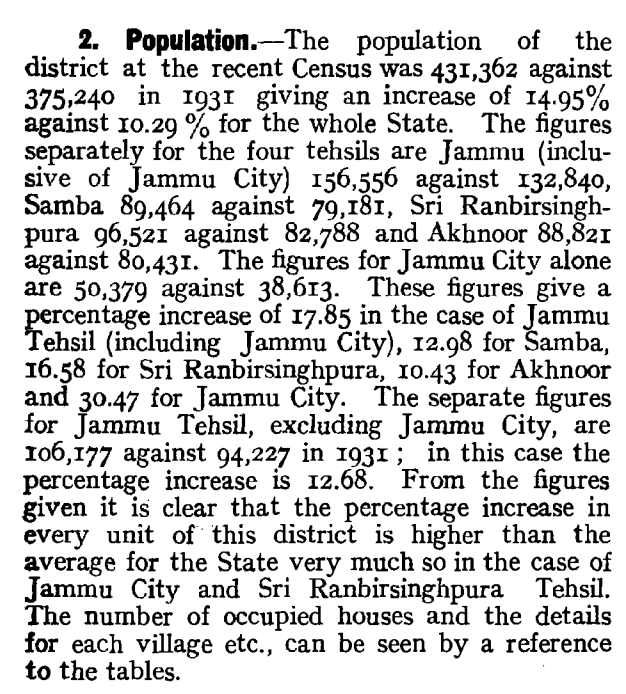
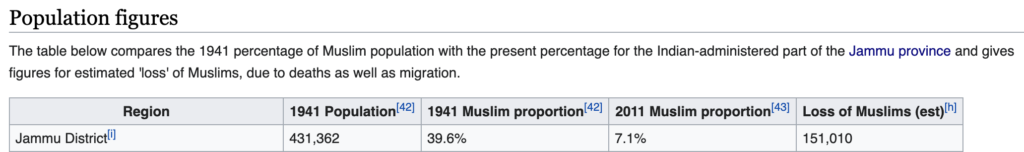
The total population of Jammu District was 431362. Of them the Non-Muslims totals were at:
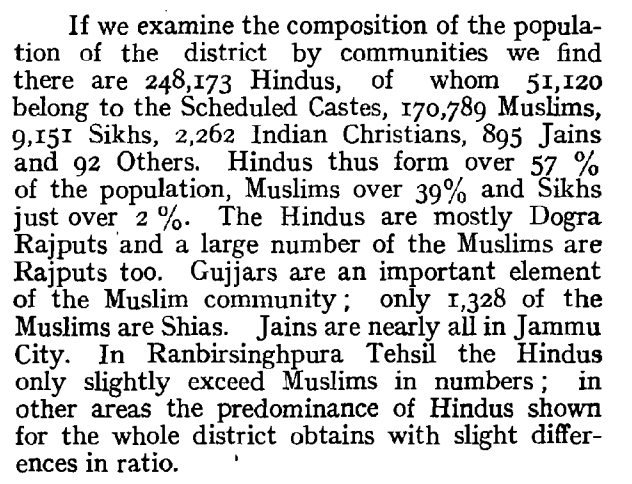
Hindus: 248,173, Sikhs: 9,I51, Christians: 2,262, Jains 895 and Others: 92. Total 260573.
They were at about 57% of the total population. Remember in 1941 there were 7.63 lakh Hindus, Jains and Sikhs in total in Jammu Division (which included Jammu District). Which means only about 34.15% of the total Non-Muslim population was living in Jammu District, rest were spread in Muslims majority areas. Which means about 65% minority was in areas which would flare up in 1947 ]
Thus, we see Jammu District (and not just the city) was Hindu majority at 57%, even as Jammu Province was a Muslims majority [bulk of this Muslims Majority Province is with Pakistan] . The killings of Muslims did not make Jammu District Hindu majority, it already was Hindu majority. [It is important to remember this because Jihadis from Pakistan still cross International border time and again to do wanton killings in this Jammu District. The ruse: Jammu was Muslims territory. Muslims were cleansed. Revenge. Reclaim “Muslim Land”. These calls have theological reasonings]
Fact is the areas where Muslims were in majority in Jammu Division in 1941, they are still in majority as of 2011 census [overall in Jammu Division [as it stands today] they are at 33.5%. [up from 30.7% in 2001].
From a study of 2011 census report:
“They form 90.5% of the population in Punch, 70.7% in Ramban and 62.7% in Rajouri. Muslim share is above 50% in Doda and Kishtwar. In Reasi, their share is near 50%; but, in the northern Gool Gulabgarh taluk of this district, their presence is much higher at 79.3 percent. Hindus have a dominating share only in the southern Udhampur, Kathua, Jammu and Samba districts and in the some of the southern taluks of the northern districts. Presence of Hindus and Sikhs is thus restricted to only to this small southeastern pocket of the State. They hardly have a settled place in the Kashmir Valley or Ladakh, and they are in a minority in the northern parts of Jammu.”
And the economic setup has been good enough that they are growing.
Same report continues: “During 2001-11, Muslims in the region have grown by 32.3 percent compared to the Hindu growth of 16.4 percent. The Muslims shall continue to grow considerably faster than the Hindus for several decades. The difference between the number of children of 0-6 year in the communities is rather large; there are 19.2 children per hundred of the Muslim population compared to 12.6 per hundred for the Hindus. Female literacy rate for the Muslims is 45.2 percent compared to 68.8 percent for the Hindus. Gender ratio for Muslims is 929 compared to 867 for Hindus.”
It numbers like these that make propagandists bring up ghost of 1947 to cause communal fissures in the Jammu District. They keep running the old lamp hoping to see the same effect now. This is not to say that all is fine in Jammu District when it comes to communalism, but people generally get along, mostly because Jammu Division offers economic sustainability irrespective of religion. Communities are part of same society and invested in it. It is a city of immigrants. From Kashmiri Pandit IDP, to LOC migrants, to Kashmiri Muslims migrants, to Kargil immigrants….everyone manages to find a place [yes, even Rohingiyas from Mayanmar!].
Most of the time it is Kashmiri Tahreekis and mainstream Politician who bring with 1947 Muslims killings. They did it as they think it is a response to question of what was done to Kashmiri Pandits in 1990 in Kashmir Division. They do it as the track record of Kashmir Division is pathetic when in comes to minorities. Minorities just cannot sustain economically. In Kashmir Division, out of total population of 68,88,475, there are only 1.60 lakh Hindus and 56 thousand Sikhs. About 3%. And this after 67.22% growth rate in Hindu population in the Kashmir province, during what is considered a time period when Terrorism was on the wane. One may think it is great [some in K media did go around stupidly patting themselves on the back about it. They went about claiming “Look we nice people too…there are 2 Lakh non-Muslims in Kashmir!”]. However, the shock of what is actually happening in Kashmir Division to the minorities is exposed by the composition of this population.
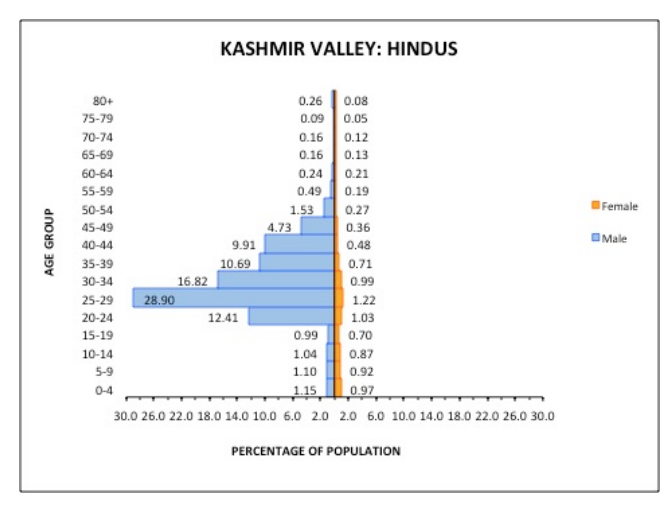
“Hindus in the Kashmir Valley are mainly adult males. In their population of 1.68 lakh persons, there are only 15.8 thousand women and less than 5 thousand children, forming 9.34 and 2.95 percent of the population, respectively. The data also shows that in the total Hindu population of 1.68 lakh, 1.48 lakh are workers; of them 1.44 lakh fall in the main worker category. There are hardly any illiterate persons among the Hindus; the number of literates in the population is 1.57 lakhs, leaving only about 11 thousand illiterates. The Hindus of Jammu and Kashmir thus comprise mainly adult, male, literate, working persons, who are in the State for work or business and not many of whom are raising their families in the State. Such a population can hardly be part of the local society. The peculiar age and gender structure of the Hindu population in Kashmir valley is starkly visible in the age pyramid of this population given on the right. The population lies almost entirely in the adult years; 88 percent of Hindus are in the prime working age group of 20-49 years. And, the pyramid is greatly skewed towards the right; 90.7 percent of the population comprises males. This pyramid is a visual representation of the fact that Hindus in Kashmir Valley no more constitute an established normally growing population. The Valley, it seems, has indeed been cleansed of the Hindus.”
Compare this with what was happening in “Jammu” from 1941 onwards, despite the killings of 1947.
Jammu City
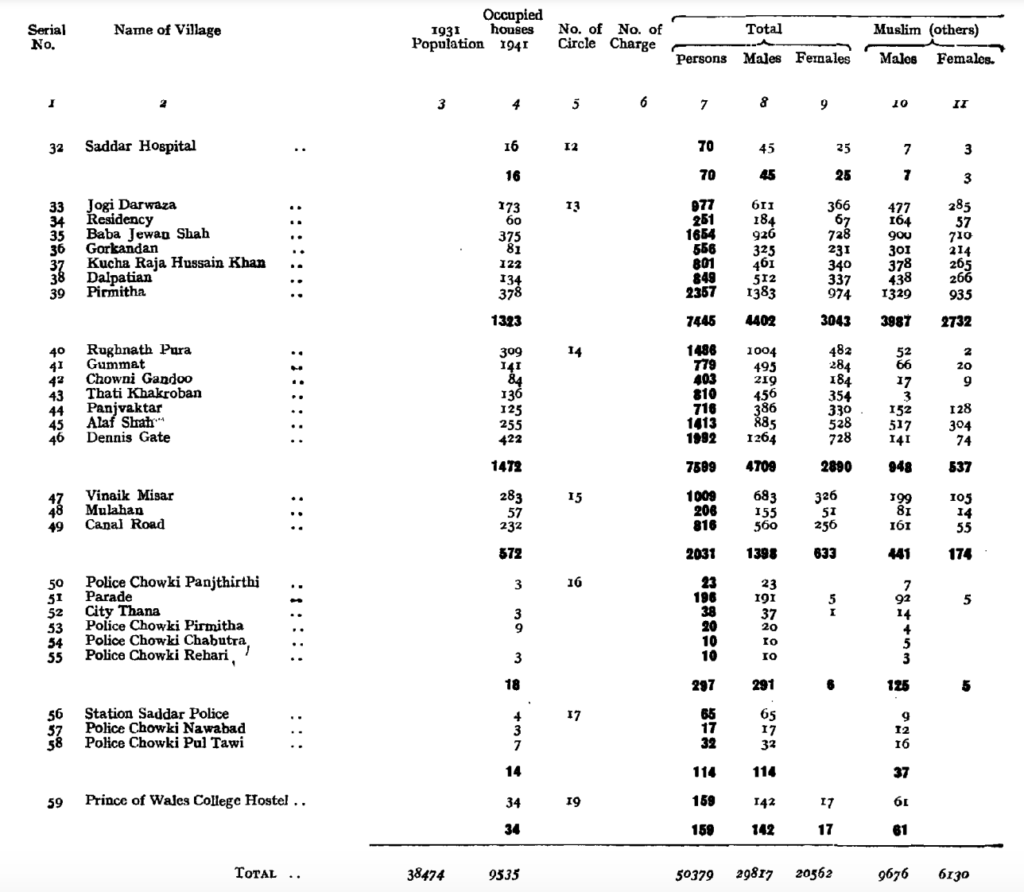
Jammu city’s population in 1941 was only 50379. A jump of record 30% from previous census in 1931. The report mentions that it is due to better administration: a growing trade and lesser epidemics. There were only 9535 houses in total. Total Muslims in Jammu city were 15920 (including 114 Shias who were counted separately). They were about 31.6%.
In 2011 census the total of Jammu City is 576198. Of them 45,815 (7.95%) are Muslim. This shows the phenomenal growth of Jammu city’s overall population compared to 1941: a 1043.7 % increase. Those who know the city, have lived in it and know its old geography, know how the city had grown in numbers in last 3 decades with people from all regions moving in and land rapidly getting “urbanised”. In the same city, Muslim population has grown at a health 187.78%. That’s almost 17% for every decade since 1941. I do believe there were killings in 1947, thus the starting number for this calculation should not be 15920 but lower. If we consider that, given the current overall growing population of Muslims in Jammu now, the decadal growth may even be higher that 20% each 10 years. Again, this shown that unlike say Srinagar (which is the other biggest city in J&K), where the numbers of minorities had gone down in %age and in absolute numbers, in Jammu city, the overall environment for Muslim population to grow is not negative [This is not to say there are no communal fault lines in city, but the rule of law does most of the time work ]. [The only alarming in all this should be that only 5.96% of Muslims in Jammu city are literate. This may also explain why Jammu Massacre propaganda is actually a targeted campaign to mobilize masses through lies].
The overall percentage of Muslims has gone down from 31.6% to 7.75%, but the reason is not because of massacres, but because Hindus from other region (besides Kashmiri Pandits, even Hindus from Poonch, Rajouri etc all places where Terrorism was normal) have found refuge in the city. Overall we can say that the number of killings in Jammu city in 1947 are exaggerated. This is not to say that killing did not happen in the city or that people did not leave home. But, given the scale of numbers in other regions of Jammu, this would have been a smaller number something around 5000.
Remember that the Jammu mentioned in propaganda is always a vague Jammu. Is it Jammu city, Jammu District, or Jammu Province? And when they do mention Province, and show their numbers, they ignore that bulk of Muslim majority areas in Jammu province went to Pakistan, the drop in Muslims % in Jammu Province with India is only natural, and not directly comparable with 1941 numbers.
Here’s I am specifically taking about Jammu District cause one would assume if such a massacre of such a scale could have happened, it could have happened in District where Muslims were in minority and Hindus in majority. In most of the papers by scholars it is Jammu District that gets discussed even if cluelessly [ref. Wiki].
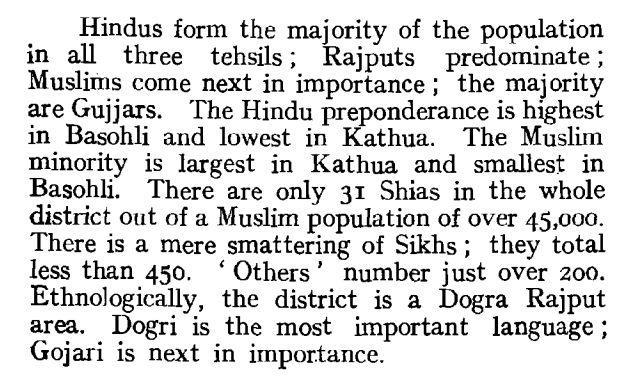
We have seen is census report Muslims were about 39% in the Jammu district but total number was just 170789. Only in Ranbirsinghpura the % age of Hindus and Muslims was comparable, Hindus just slightly ahead. Again it should be remembered the Ranbirsinghpura of 1941 is not same as R.S. Pora of today. In 1941 Tehsil Ranbirsinghpura had a total population of 96521, while in 2011 R.S. Pora city (which comes from RanbirSingh Pura) is only 15917. Akhnoor city today is 20,756 and in 1941 the Akhnoor Tehsil overall was 88821.
To make sense of what happened in rest of the Tehsils of Jammu District, we try to make sense, one by one.
Sambha District
From verbal accounts we know that there were killing in Sambha.
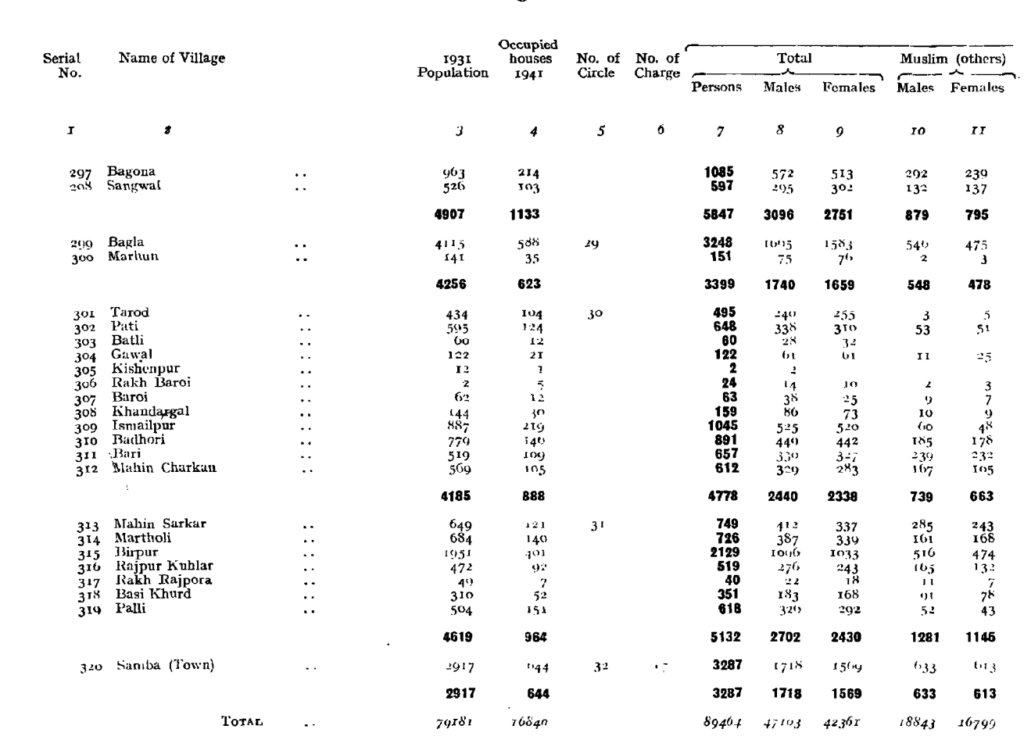
In 1941 the total population of Sambha Tehsil was 89464 of which 35642 were Muslim at ( 39.84%).
In 2011, Sambha Districts population is 318,898. Muslim population is at 22,950 (at about 7%). %age here is again immaterial, in absolute we can see decline. It is here you start seeing the impact of 1947. On randomly checking village level data of 1941 Sambha and now (the total villages no. are almost same (about 300), thus comparison is easy), one can see quite a few villages are almost the same size in population as they were in 1941. A lot of villages have considerable Scheduled Caste population. Only few villages have grown into bigger number and having bigger impact on overall population. One can safely assume (based on avg. Muslim decadal growth in Jammu city) that back in 47, the no. of Muslims may have gone down to 10000-12000. About 10 to 12 K missing.
This is on the same scale as what happened to minorities on the other side of the line and generally in Punjab as well as Bengal. People caught in majority areas and near the dividing line, had to flee and many were killed en-mass even while fleeing. But, this is still not on the same scale as what happened to minorities in POK as on that side there is still no minority. The change there was absolute and final.
Akhnoor District
Again a place where in oral accounts killings took place. Most of eyewitness accounts, and the progenies of refugees from this area who moved to Pakistan, do make a special mention of it.
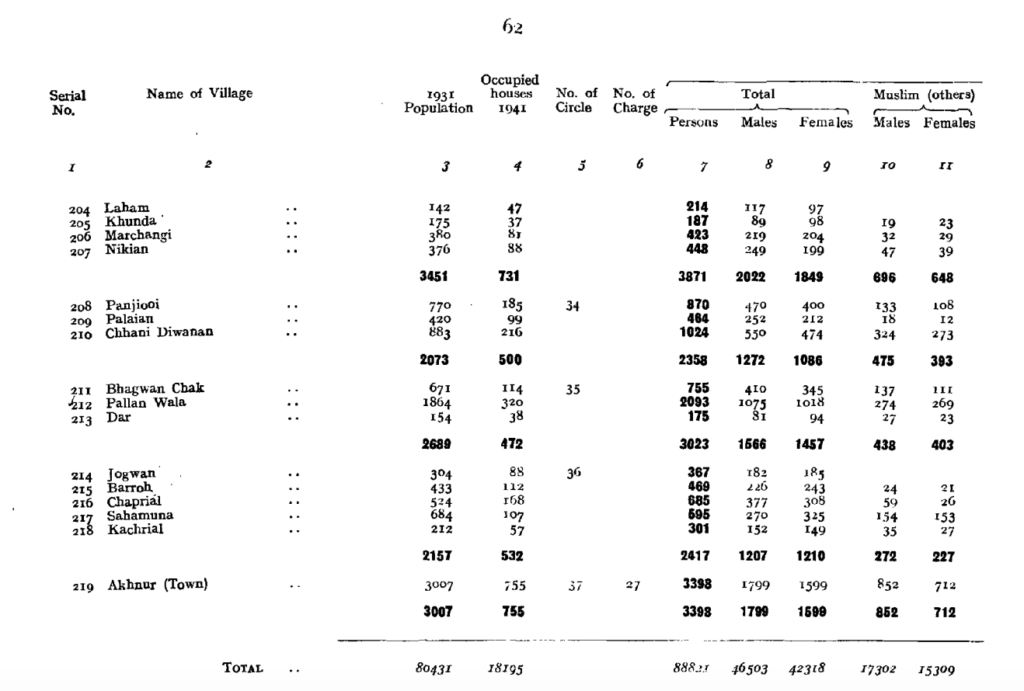
In 1941, the total population of Akhnoor District was 88821 [the city was just 3398, today it is 20,756]. Muslims were 32611 in the district, about 36.71%.
In 2011, total population of Akhnoor Tehsil [about 225 villages] was 2,50,446 [an increase of about 182% since 1941]. Muslims are just 6145 at 2.45%. We can safely assumed in 1947, Akhnoor District may well have not more than a 2500 Muslims left. That’s about 30K missing.
Kathua District
Now let’s look at Kathua District, again a place where there were reports of mass killing. The Tehsils under Kathua District in 1941 were Kathua, Jasmergarh [now known as Hiranagar] and Basohli.
Kathua District in 1941 has a total population of 177672 [ spread over 2649.5578 km²]. There were about 45000 Muslims in the district, about 25.33%.
In 2011, the total population was 6,16,435 [in some records actual total area right now is shown at a reduced 2,502 km²]. Number of Muslims 64,234 or about 10.42 %
Again, even though the total number is higher than 1941 and overall they are at 10%+, we can infer that post 47 violence, Muslims in this District went missing (killed or crossed over. Important to remember there were a Lakh of refugees registered in Pakistan, exact figures never made public ). Again we can assume to arrive at 65K population in 2011, and considering average decadal growth rate of 15%. In 1947, the number of Muslims would have reduced to about 20000. That’s about 25K missing.
[Not looking individually into Hiranagar Tehsil [which is now a Taluka] and Basholi. There were about 15000 Muslims (of the total 45000 in Kathua District ) in Hiranagar, at about 30%. About 12000 were in Basohli at about 17%. We can safely assume it is the same pattern, ]
Sri Ranbirsinghpura Tehsil
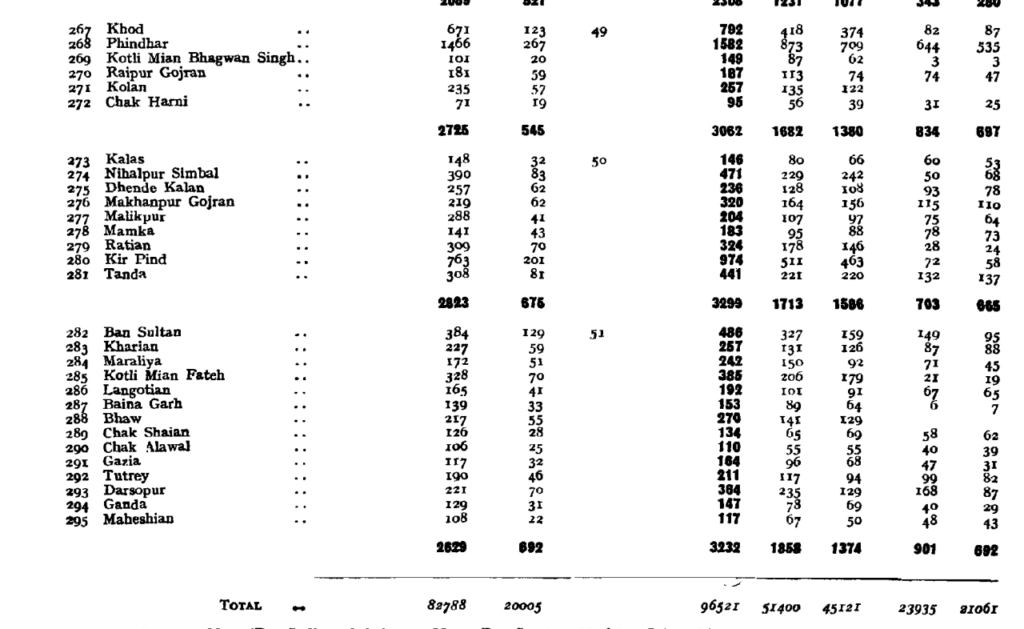
Total population of Ranbirsinghpura in 1941 was 96521. Muslims were about 44996 or about 46%. As the original note to census in 1941 noted, this was one of the places in Jammu District where Hindus and Muslims were in comparable number.
In 2011 census, out of total population of 197,739 only 4,994 are Muslim (about 2.53%). We can safely assume almost 43K went missing. It should be noted that about 38.8% of the current population is SC while 2.2% is Schedule Tribe (ST).
Udhampur District
This was the other major Hindu Majority region in 1941. Udhampur District back then comprised of Tehsil Udhampur, Kishtwar, Ramban, Ramnagar and Bhadarwah. Of these only Kistwar and Ramban were Muslim majority.
Post 1947, there have been rearrangements in these Tehsils, as some are now separate Districts. Bhadarwah is now under Doda District, and in 1941 Doda village [where Opium was grown] was in Ramban Tehsil. Ramban District was carved out of Doda district in 2004.
Ramban District:
In 1941, Total population. 75793. Muslims population 53670. About 70.8% Muslim.
In 2011, total population 283713 [about 428% increase] with Muslim at about 70.68%, which almost same as 1941.
No change. Safe to assume, in 1947, these places were practically untouched. Point to note, the places are hill (unlike Akhnoor, Samba, R.S. Pora…which are practically plains of Panjab ) and far off from partition violence that engulfed areas while the new border came up.
Interesting thing to note about Ramban Town (not the district). In 1941, the total population of the town was 667 with Muslims comprising 24.88% with number of 166. Which means the main town of the District was Hindu Majority. In 2011, we see the same. The total population of the town is 3,596 with Muslims at 1491 now forming 41.46% of the town. This does not mean that in 1947 Hindus of the town were massacred. What it means is what we see on ground in Jammu District, a tickle of Hindu population moving to Hindu areas and Muslims to Muslim areas, all over the last few decades. But mostly, overall the places are stable. All this happening parallel to the economic growth of these once small dots on hills, that are now towns.
In 1941, Doda village had population of 1312 and were 792 forming about 60% of the population. In 2011, Muslims form 66% out of the total population of 25527 and the town has seen 1845% growth rate from 1941. Strange thing, in town only 9189 females are there, which means quite a few, probably the non-muslims are there because of work, with their families elsewhere.
Bhaderwah District
In 1941, total population was 44518 and of them 20392 were Muslim at 45.8%. It had about 310 villages.
In 2011, Bhaderwah Tehsil [now in Doda District] is having only about 118 villages. Since direct comparison is not possible. We can see what happened in Bhaderwah Town and its demography.
In 1941 the total population of town (Bhaderwah + Nagar) was 3546 and Muslims were at about 64% with number 2273.
In 2011, total population is 11,084 with Muslims at 8312 forming about 75%. So, here also there is an increase. We have to assume this pattern would be for the whole Tehsil also.
From all this Data about former Udhampur District, it is obvious that there were no massive missing numbers in 1947. And post that there has been consolidation of numbers and bifurcation of District along the lines that seem communal. A Muslim majority district was carved out of a Hindu Majority district. Now of course there is demand of Chenab valley to be separate completely from Jammu Division. The is a growing population that seeks and needs more resources. But, it is fears of 1947 that keep such matters in limbo.
Reasi District
In 1941, Reasi comprised of two tehsils: Reasi and [Rampur, named in Gulab Singh era] Rajouri.
Reasi in 1941 had a population of 117059 and of them 64144 were Muslim at 54% spread over 326 villages.
Rajouri at 140844 and of them 111359 were Muslims at 79%
Post 47 there was a lot of shuffling of these districts. Rajouri Tehsil of 1941 is now Rajouri District. Reasi is a separate District. So we can look at them separately, but the composition and area of Reasi has also changed. For example, back in 1941 Nandimarg village [where 2003 massacre of 25 Hindus was carried out by Pakistan based Terrorists] was part of Reasi even though it was on Kashmir side and bordering Kulgam.
Back in 1941, Reasi was about 2545.96 sq.KM. Now it is 1,719 sq.KM. We can ignore it to and still look at 2011 numbers. Reasi in 2011 had a total population 314,667 spread over spread over 259 village. There were 156,275 Muslims at 49.66%. So the basic split is maintained.
In case of Rajouri, back in 1941 it was spread over 2087.53 sq.KM and now it is 2,630 sq.KM. In 2011, it had a total population of 642,415 with 402,879 Muslims forming 62.71%.
Poonch District.
In 1947 war, this was the region that got majorly spilt. Back in 1941 it was 4213.911 Sq.KMs. Area retained by India is only 1,674 Sq.KMs. The access to Kashmir from here was via Haji Pass and then onto Uri. This pass has been site of wars. Other route is from Mendhar to Shupian in Kulgan. Mendhar post 1990 has been the route for terrorists to enter Kashmir valley.
There is no simple way to co-relate 1941 numbers to 2011 numbers as the borders have changed. Poonch Jagir back then comprised on Bagh, Sudhnoti, Haveli and Mendhar.
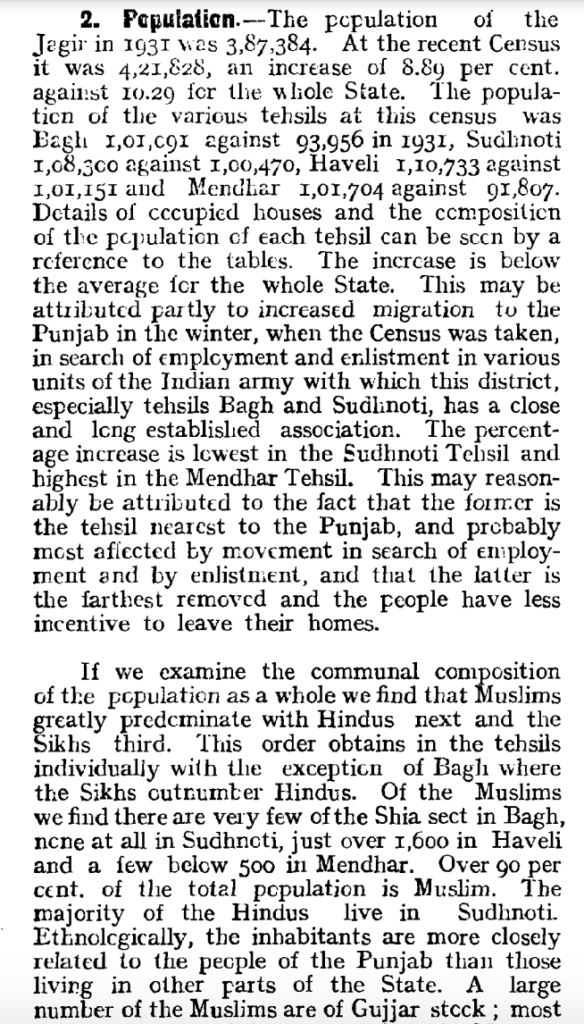
Total Population of Poonch Jagir in 1941 was 421828 and of them 380172 were Muslim or 90.01%. There were 41656 non-Muslims in the region and about 18166 of them were in Sudhnoti which is now in Pakistan with 0 minority presence now. It is said killing in Poonch started after State troopers killed some Muslims in Bagh town in August 1947. In 1941, population of Bagh town was 1186 and Muslim were 773 at 65%. Sikhs were 208 about 17.5%. After 1947, entire Bagh and part of Haveli was taken by Pakistan. In 1941, there were about 9340 non-Muslims there.
Meanwhile the Poonch region now with India (parts of Haveli and Mendhar) still is about 90.45% Muslim. Interestingly, 1941 Poonch town (in Haveli Tehsil retained by India) had a population of 8608 with Muslims at 5248 forming 60% of population. In 2011, total population was 26,854 with Muslims being 8993 at 33.49%. Sikh who in 1941 were only about 7% in town are now 20.79%. This anomaly is only seen in this town. Possibly because urban Muslims may have left or killed in 1947 and refugees from other side of Poonch taken their place here. This did not happen in Jammu city. In Jammu city, the number of Muslims does not show this data behavior, even if their overall percentage has fallen, the overall population has shown comparative growth.
Conclusion:
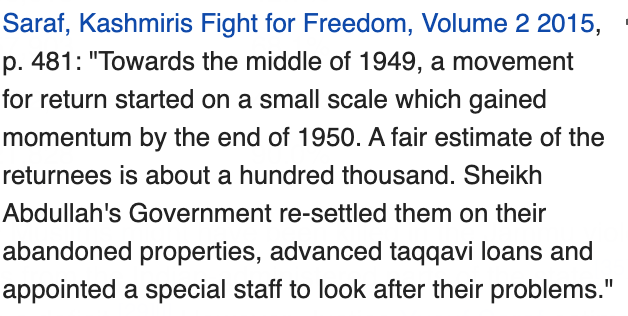
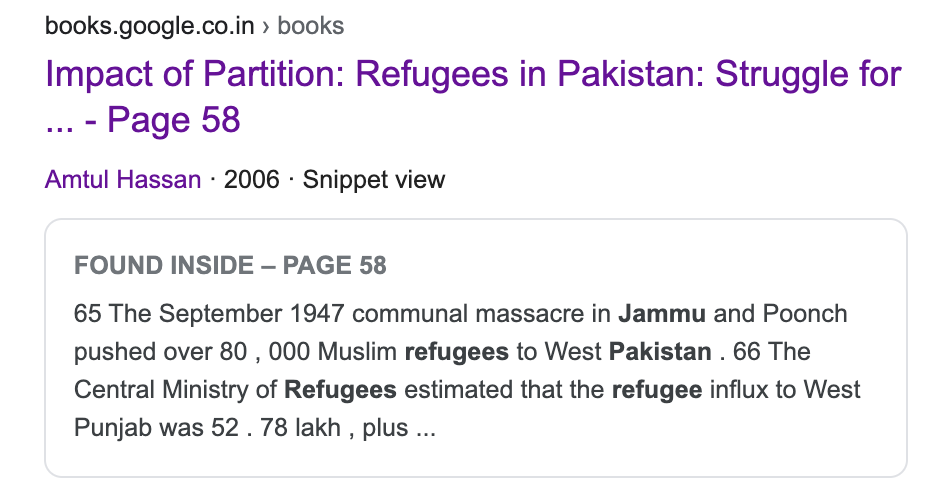
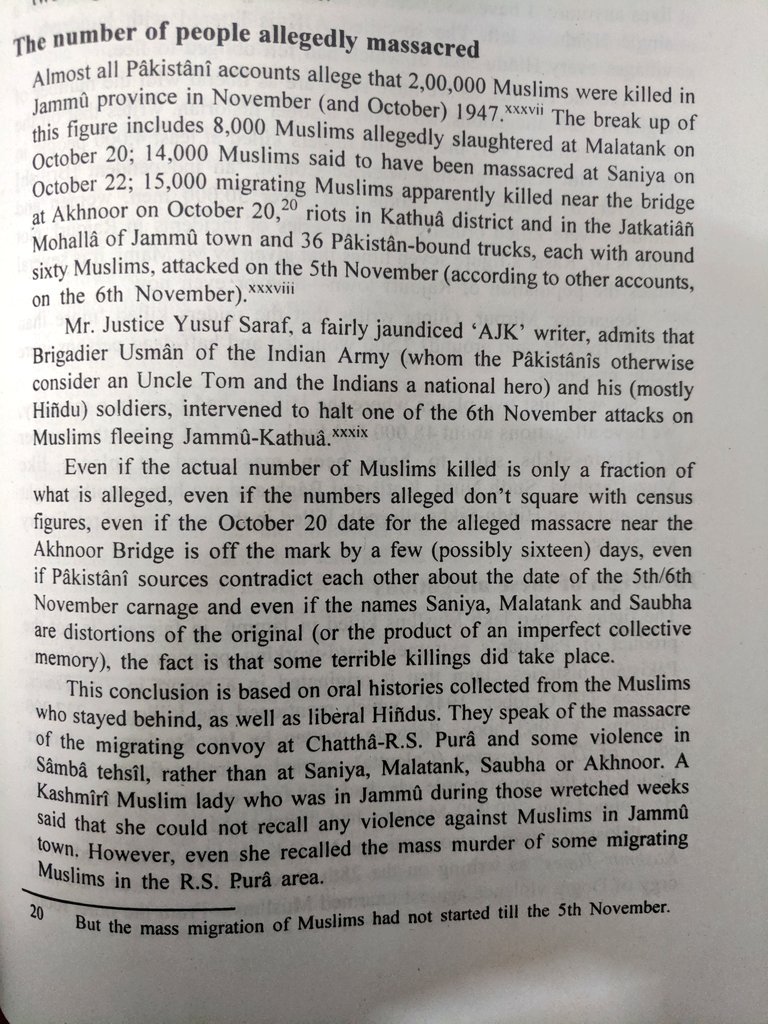
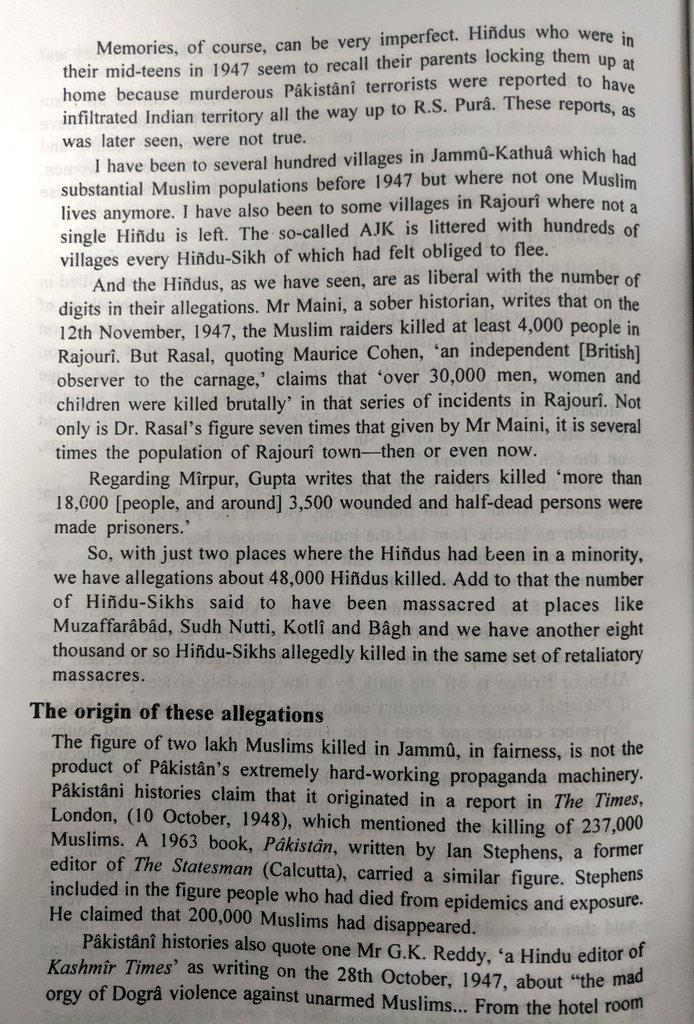
Adding up 12 K missing in Sambha District, 30K missing in Akhnoor District, 25K missing in Kathua District and 43K in Ranbirsingh Pora, we get a figure of about 110000 missing in Jammu District. In propaganda it would have been written as 110000 Lakh killed. However, we have to assume no matter how brutal the killing, a good percentage would have crossed over, just like it happened in rest of India where riots took place in 1947. In Pakistani accounts, it is well reported that after September 1947 killings in Jammu and Poonch, there were about 80000 refugees in Pakistan. This makes actual number of Muslim killings clear.
The objective of this number churning exercise was not to demean those to died violently or were forced to leave their home. Even a single village on either side that was cleansed of the “other” is wrong. The objective was to show how over the decades the killing numbers have been exaggerated and manipulated for pure propaganda purposes.
In 1947, killings happened on both sides but only one side tried to still live with the “other”, tried to solve complex problems and find ways to evolve together.
-0-
P.S. A good read on the subject of Jammu Massacre
-0-
-0-
Ref:
for 1943 Administration Report
http://lsi.gov.in:8081/jspui/handle/123456789/5824
for quoted part about Jammu Division on 2011 census:
https://www.cpsindia.org/dl/Blogs/Blog%2015%20J&K.pdf
for 2011 Census Data
https://etrace.in/census/town/jammu-jammu-and-kashmir-800071/